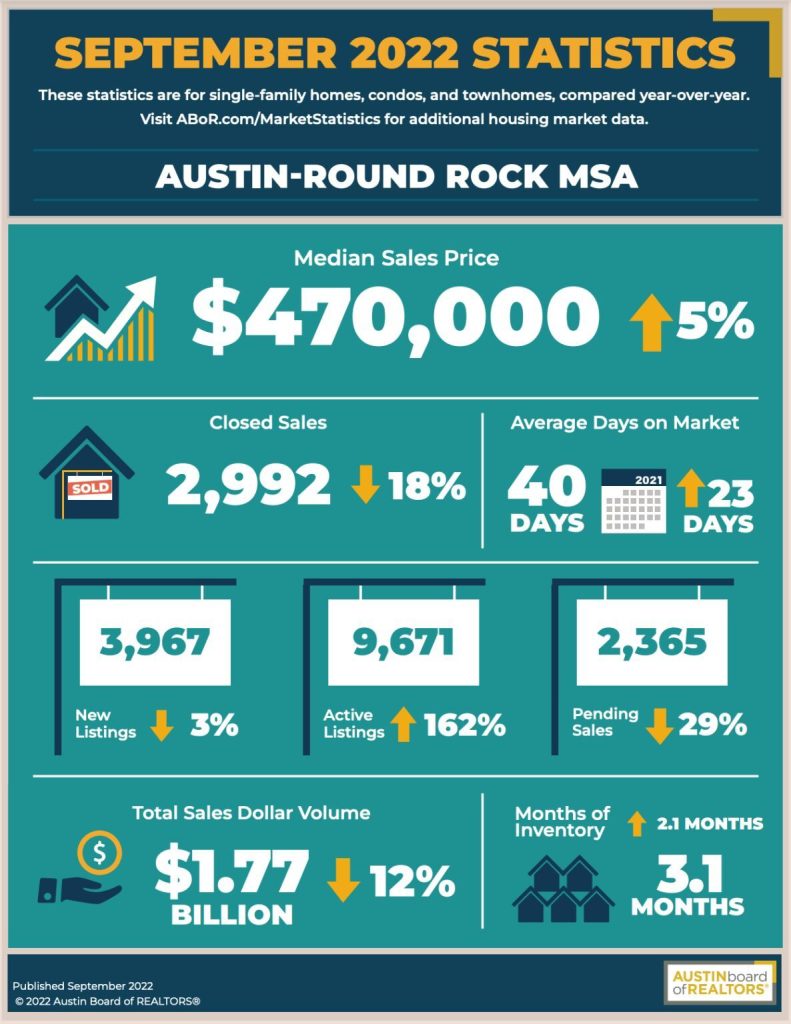
Let’s break these numbers down!
- Home prices are STILL up year over year!
- Closed sales are down 18% (This simply means there are few ‘transactions’ taking place… Interest rates have risen and put some people on pause).
- Average Days on Market (up to 40 days, from 23 a year ago. This means the multiple offers/bidding wars on launch weekend, and massive purchases over list price are in the past … for the most part!)
- The number of new listings is down 3% (which is pretty much statistically insignificant ;-), BUT with pending listings down nearly 30%, THIS is why we’re seeing so many active listings!
- Months of inventory is at 3.1%. A BALANCED market is 4-6 months of inventory, so we are just inching out of a hot seller’s market, headed towards a balanced (aka HEALTHY) real estate market!
A balanced market is due to several factors, such as:
- Interest rates on mortgages
- Amount of new housing construction
- Employment and immigration
- Inflation
NOTE: Real estate is a hyper-local industry. These stats are for the full market area If you want to see how your particular neighborhood or zip code is doing, message me and I can run the individual stats for you!


